![]()
|
|
|
Is your System analysis of trends and detected faults too time consuming? Part one: Harmonics The 24/7/52 automated measurements are performed roughly hourly, depending on how many sensors are in the system, and this is where the cost benefit appears, compared to walk around systems which often provide only 1 measurement per month for manual analysis and trending. Manual collection and analysis becomes mentally intense, slow, boring and prone to errors, when a machine with several shaft speeds and many rolling element bearings is being monitored. Our Online Condition Monitoring System does this painstaking work for you in the background, and alerts you only to significant divergences from normal condition, by email and instant SMS messaging. This saves huge amounts of “people time” and is where cost benefits appear. The harmonics of each shaft speed are highlighted in order of speed, red, green, mauve, yellow and 100 harmonics of each are highlighted. All highlighted (sync) lines are considered gear related and the rest bearing related. The highlighted bearing outer ring fault harmonics and sidebands are seen to fall on non sync lines. Consider how long it would take an analyst to figure all this out with starting with a rough shaft speed, a known number of gear teeth (19), a bearing number, and a calculator! With our system you see it all at a glance, after the trend program sends you an SMS message 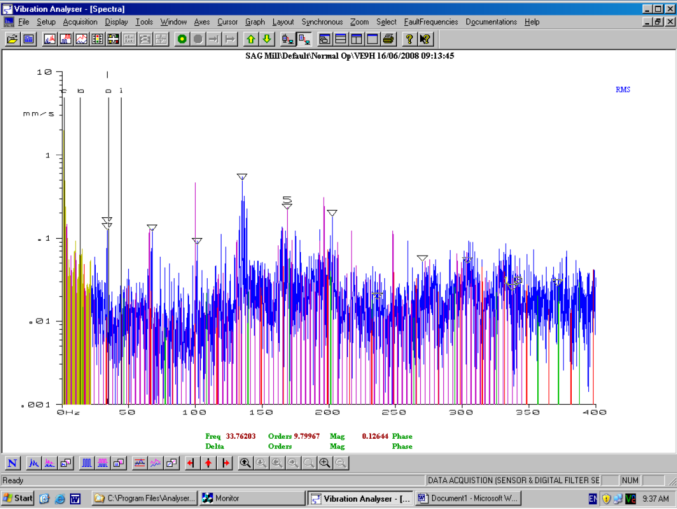
Part two: Trending Sync and Non Sync vibration in the band The spectrum shows bearing vibration frequencies cover a huge number of spectral lines so a representative value of the total vibration from the bearing is not just a single dominant harmonic or harmonic series, but the RMS sum of all lines associated with the particular fault in a band. We achieve this by RMS summing all non sync lines in various bands, and trending them. By hand this impractical, so manual estimation of bearing fault severity is generally understated, and more time consuming to reach an answer, and this is where the cost benefit appears. These two “non sync” vibration in the band curves cover 2 areas of the spectrum, the first 6 outer race harmonics (9-64x shaft speed NS) and (65- 196x shaft speed NS) and the rms sum of the two give the total bearing vibration. The higher band often highlights the earliest signs of faults. These ranges are also chosen to suit “sync” gear vibration, as the first covers the first 3 harmonics of tooth meshing frequency and the second covers the next 7 harmonics. The higher harmonics often give the earliest signs of tooth face errors and the lower harmonics become dominant later in the wear process. The flat tooth wear trend in this example is passed over for this discussion. 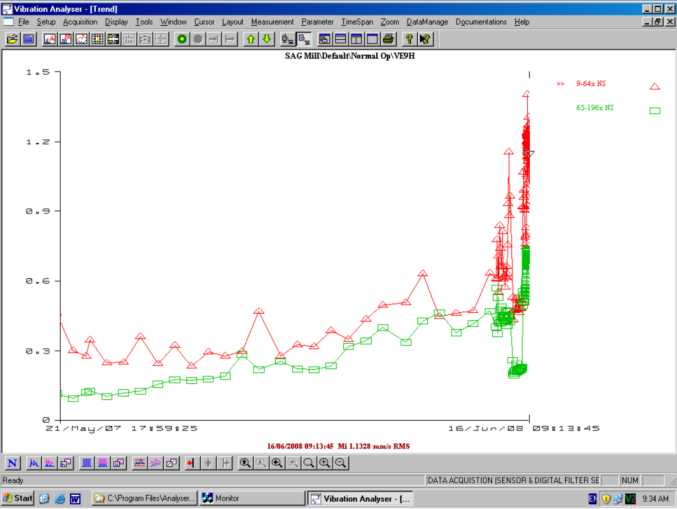
The trends are close to exponential towards the end of life and in this case the lower harmonics have always been large since the system was installed. The sudden drop in both drive end brg trends a week before the repair is due to the accelerometer leads being mixed up after a bearing inspection, so the drop shows the non drive end brg vibration. Most of this is transmitted from the drive end via the foundation, and later we’ll show that the fault only shows in demodulation on the drive end, because this high frequency vibration does not transmit very far. Separate trending of these parameters allows trending of small bearing faults in the presence of larger gear vibrations, in a fully automated manner, without needing to calculate bearing frequencies. |