![]()
|
|
|
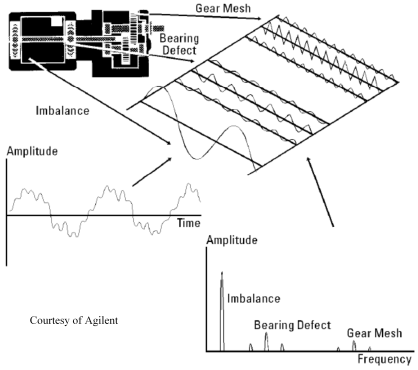
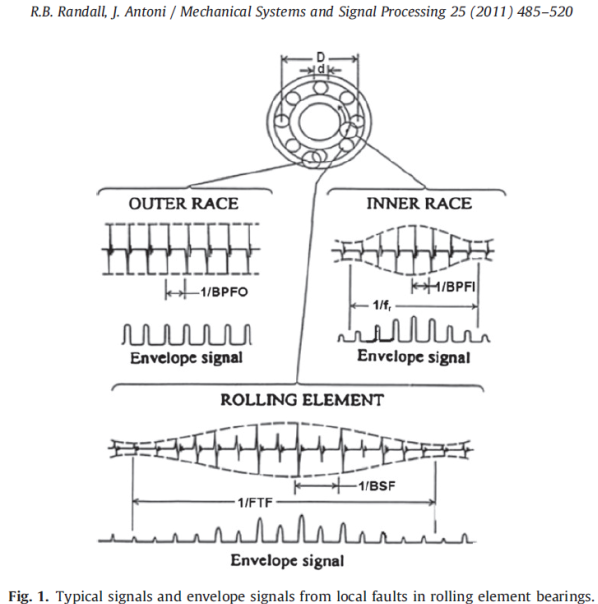
Technology: Machinery Vibration Concepts 1. What we measure This is a 2D representation of the time and frequency domains with the sources of each frequency. Any real world time domain signal is composed of many sine waves, each from a particular part of the machine, and what we see on an oscilloscope is the algebraic sum of these signals, which appears complex to the eye. The fft process can decompose that complex signal into it’s individual frequencies without loss of data, and each frequency represents one of the pure sine waves, that when added together create the initial complex waveform. Machine vibration is seen in experiments in both the time and frequency domains depending on how we choose to display it, not because it is one or the other. You can think about it like an photon, which can appear as a particle or a wave depending on the experiment, not because it is one or the other. And possibly, in the case of the photon, if we could perceive more than the 4 dimensions, it would appear in yet more forms.
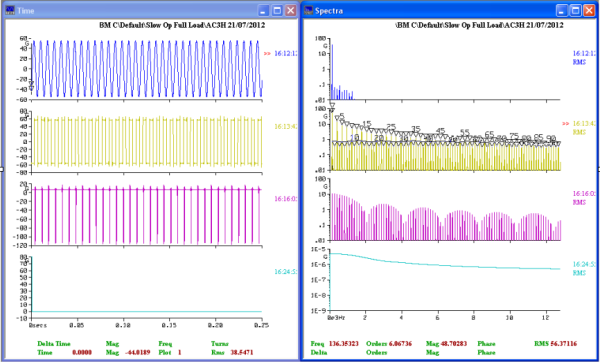
The above diagrams refer to low frequency vibration from shaft imbalance, misalignment, looseness, bearings and gears as the surfaces roll over each other, which typically are about 100 x shaft speed. For a 4 pole motor running near 25 Hz that means a frequency range of around 2500 Hz. We can feel this type of vibration by hand and also hear it as a low rumble because we can hear well down to 300 Hz and less well to 100 Hz. We can identify and separate shaft related faults, gear and bearing faults by the frequency at which they vibrate which are all dependant upon knowing shaft speed. A vibration at 1x shaft speed is most likely caused by imbalance. A vibration at 22x shaft speed is most likely caused by the meshing of the 22 tooth gear on that shaft. A vibration at 5.327523x shaft speed is most likely caused by a rolling element bearing on that shaft. The difference between a bearing fault and a gear fault is the bearing fault will be a non integer multiple. In practice these are not sine wave vibrations so they produce harmonics which make them more recognizable. You can also think about it as driving a car down a street with 3 alternative surfaces :- A/ an uneven curved surface, causes the car to pitch and roll on it’s suspension, no impacts or noise. B/ a a pot holed street, the tyres enter the holes and impact on the far edge, causes pitch, roll and dull impacts. C/ joints in a concrete slab road, no pitch or roll, just very sharp impacts and the noise of each impact. In most machines, when the rolling surfaces are cracked or pitted with sharp edges, typical of early fatigue stress cracks, the machine elements impact and bounce rather than roll, and they produce high frequency vibration (sounds like hitting a steel plate with a light hammer) going well beyond our range of hearing around 14 KHz. The following graphs illustrate the progression from smooth sine waves to very impulsive waves. First row The 136 Hz acceleration sine wave is continuous in the time domain & discontinous in the frequency domain. It is represented by a single frequency peak and some low level harmonics because it is not a perfect sine wave. These waves are generally low frequency, ie imbalance, and only excite resonances at similar frequencies. Second row A square wave (1:1 mark/space ratio) is made up from a series of sine waves, 1x, 3x, 5x etc (dominant odd harmonics) and extends for 100’s of harmonics past the fundamental 136 Hz, BECAUSE of the square corners which require a huge number of very high frequency waves to combine to form this shape. Third row An impulse train (1:15 mark/space ratio) is made up of a series of sine waves, 1x, 2x, 3x etc and extend for 100’s of harmonics for the same reason as the square wave. Note the 15x, 30x etc peaks are missing (very low) in this waveform, and every second in the above square wave, and corrrespond to the mark/space ratio which is 1:1 for the square wave. Forth row A single impulse (Dirac function) is the extreme of impulsiveness (the exact opposite of a sine wave) because it is discontinous in the time domain and continuous in the frequency domain. It’s frequency range depends on it’s width. Note that it envolopes the row 3 spectrum quite well, but for the 15x, 30x etc, dips. It is just on pulse of the above pulse train so has much less total energy, hence the low level spectrum. This is the basis of the impact test in modal analysis because sharp impacts ring nearly all the harmonics of a machine simultaneously. Accoustic emmision sensors pick up these very short impulses, caused by metal crystals deforming plasticly and cracking in the process. (These short sharp waves are easily damped and stopped at dry joints between outer races and housings.)
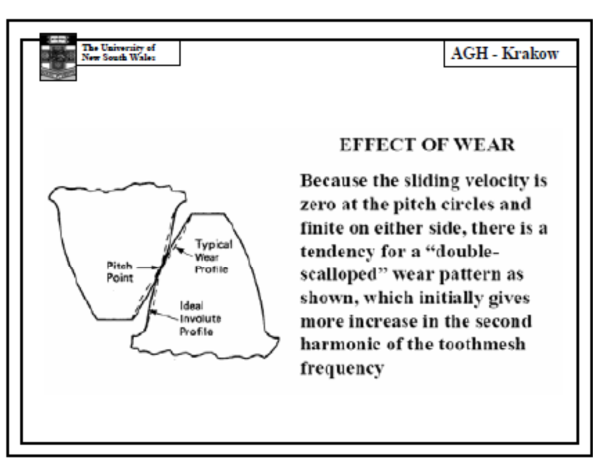
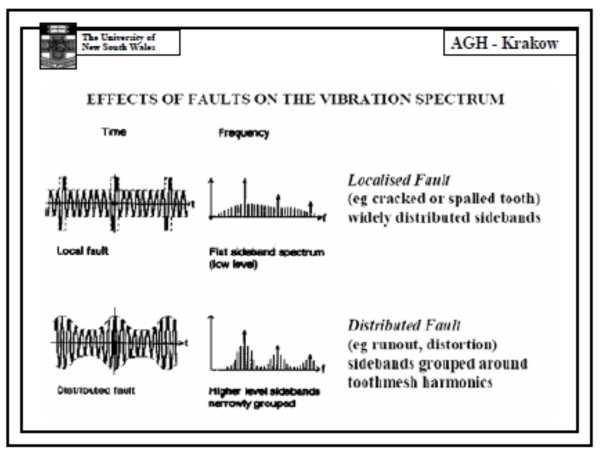
Tooth meshing faults are the easiest to explain and are due to :- tooth profile wear distributed evenly around the pdc, eccentric gears (bent shaft) which show a smooth variation of tooth meshing vibration once per rev of the shaft, and single tooth faults which produce an impact once per rev of the shaft.
Bearings are slightly more complex but still do similar things. They work like a friction driven epicyclic gearbox and the impact rate is dependant on :- The number of balls N The ball diameter d The pitch circle diameter D The result of these dimensions means the vibration will be a non integer multiple of shaft speed. The only bearing which produces synchronous vibration is a thrust ball bearing because both rings have the same rolling circumference, and radial bearings do not. Apart from the frequency difference between an inner, outer or ball fault, there is a variation in the impact severity for inner ring and roller faults, and the period is shaft speed and cage speed respectively. An outer ring fault produces constant sized impacts because each roller impacts under the same load conditions.
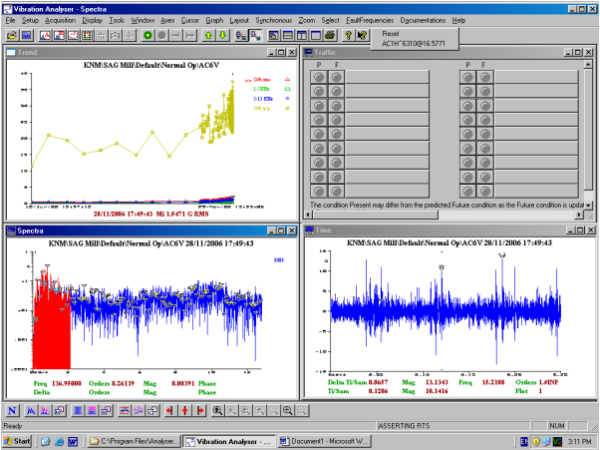
This real world data shows the trend, spectrum and waveform in Acceleration of moderate inner race fault fault. The impacts excite vibrations out to 20 or 30 KHz decreasing with frequency, and 12.8 KHz is enough to capture the majority of the signal for severity estimation and trending. Note the 3 turns of the shaft and 3 to 6 rollers creating impacts as they go through the loaded zone within 0.25 seconds of waveform.
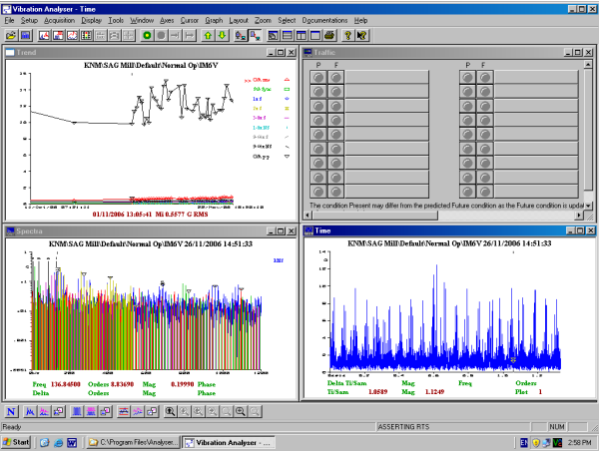
To get a better estimate of the repitition frequency we can “high pass filter” to reduce gear vibration effects and “envolope” the acceleration waveform. This process is called “demodulation” and the result is to preserve the impact rate but present it at a lower frequency range of 2400 Hz which means the measurement time is longer at 1.3 seconds and the spectral detail is amazing, showing the harmonics of the inner race fault and the shaft speed sidebands around each peak. The shaft speeds of the 3 shafts are highlighted different colours and the bearing fault frequencies can be seen to be mostly non synchronous with any shaft. The waveform peak hights are the same as the accelertion waveform so nothing has been lost.
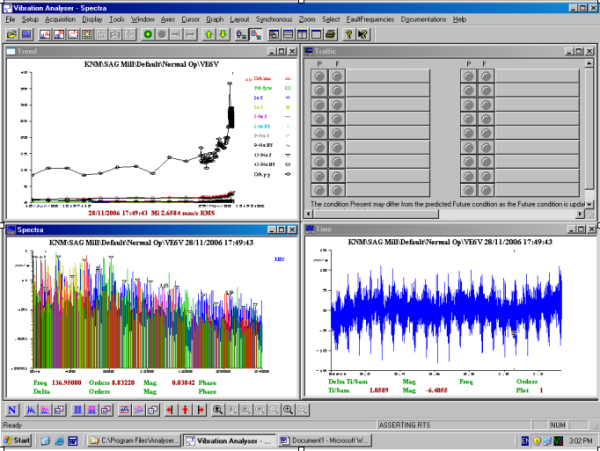
The low frequency hand felt vibration Velocity trend, spectrum and waveform show a strongly exponential characteristic which predicts the end much better than the high frequency vibration trend which is flatter. The lower frequency range of 2400 Hz means the measurement time is longer at 1.3 seconds so the repitition rate of the impacts is more accurate and detailed.
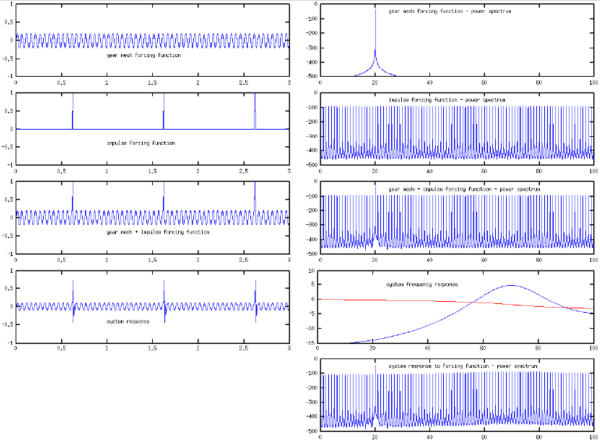
2. The relationship between forces and vibration Machinery vibration is the result of forces from individual machine parts and it’s modal parameters. Consider the following example :- Tooth meshing forces from a 20 tooth gear, & a “once per turn” impact from a damaged tooth are added. The summed waveform is fft’d and multiplied by the system response fft in terms of magnitude and phase.
(Sum of Forces) (N) x Machine inertance (g/N) = g’s The result is the measured machine vibration in g’s. (We can integrate this result to mm/s if wanted.) Note the general rise in the spectrum around 70 Hz due to the modal parameters (directly above). Spectrum analysis can separate the vibration response of the 2 faults by different frequencies of occurrence but it can’t separate the forcs from the modal parameters. The Cepstrum can do this function, for details click on the Cepstrum menu item. |