|
Technology: Variable Speed Machines
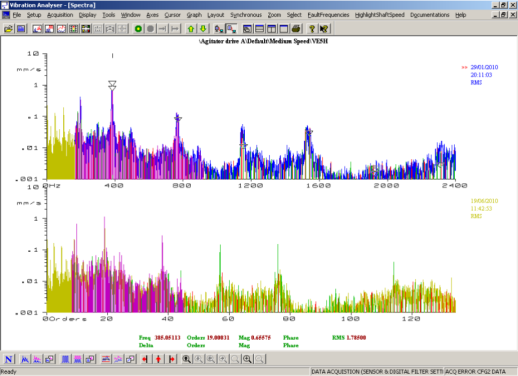
Condition monitoring variable speed machines using fixed period time sampling is acceptable if they only vary speed slightly as the vibration spectrum becomes only slightly “smeared”. If the machine 1x speed varies by +/- 1% then for an input shaft speed of 20.2658 Hz driving a gear with 19 teeth, the tooth meshing frequency, nominally 385.05113 Hz, will vary by the same % amount.
If we have a spectrum of 3200 lines and 2400 Hz range (top spectrum) the 1x harmonic will fall on line number 27.0211 +/- 0.2702 lines which may not be noticed, but the tooth meshing frequency at 385.05113 +/- 3.8505 Hz will fall on line number 684.5353 +/- 6.8454 lines, ie it is “smeared across 13.7 lines” which for constant energy has the effect of reducing the spectral peak heights significantly. It’s 2nd harmonic will fall on line number 1369.0707 +/- 13.6907 lines, with double the smearing, which further reduces peak heights and also makes sideband recognition impossible, and the spectrum useless.
A process called “Resampling” overcomes this problem by measuring a tachometer signal pulse simultaneously with the vibration signal. The rising edge of each “once per rev” pulse is timed to the next pulse to determine the time between pulses, and hence the speed for each turn of the shaft with the tacho on it, for the whole of the sampling time.
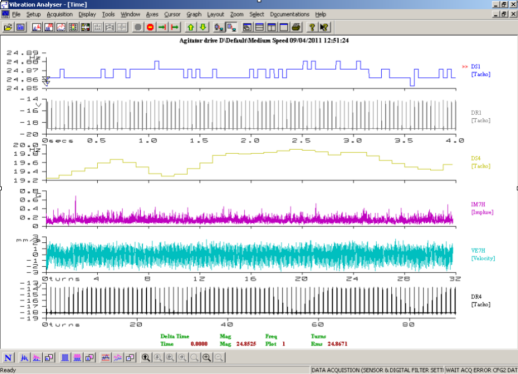
These waveforms are from a 4 pole induction motor (near constant speed) driving a torque converter with a feedback speed controller (with poor control response) to provide a variable speed input to a large gearbox which drives an agitator with randomly varying torque requirements.
DR1 is the motor tacho waveform in time (4 sec) and DS1 is it’s speed map over those 4 seconds.
DR4 is the gearbox input shaft tacho now converted to “turns” (90 turns) and DS4 is it’s speedmap with it’s steps in line with the tacho shaft turn steps. Note the 1 Hz wander in 20 Hz average speed = 5% approximately.
For completeness, VE7H is the velocity wave form at brg 7 horiz, and IM7H is the demodulated acceleration waveform at brg 7 horiz.
These oddly spaced points in time are then stretched and compressed as needed to position them at equally spaced points on an X axis now called “turns”.
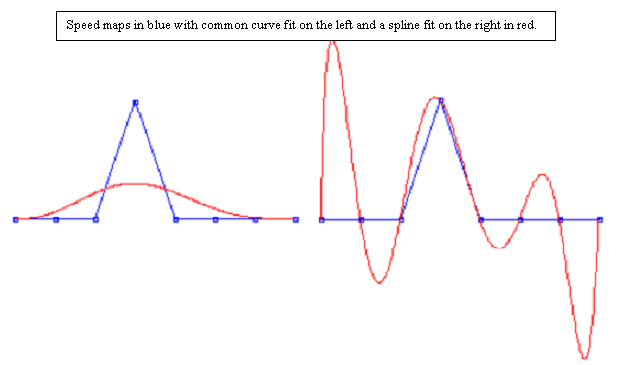
At the end of each turn we know the machine speed for that turn and create a “speed map” by placing a point at a height above a base line at each “end of turn” point, shown as blue dots and lines below.
The problem is we don’t know what the speed did during each turn !
A common polynomial curve fit on the left assumes the data is not accurate and does a “best fit” which is useless.
The “spline” fit on the right fits a curve (red) through each accurately measured data point, and oscillates as the machine speed must have done to create these data points.
The spline curve is generated as a parabolic fit of 3 points, connected to a parabolic fit of the next 3 points, etc, with each parabola joined to the other by equal gradients of their curves. (key point)
Having the whole of the time sample is central to the curve fitting accuracy, as everything is known.
An analogy to damping can also be introduced to control the oscillation size and optimize the curve to what the shaft must have done during each turn, and the problem is fixed.
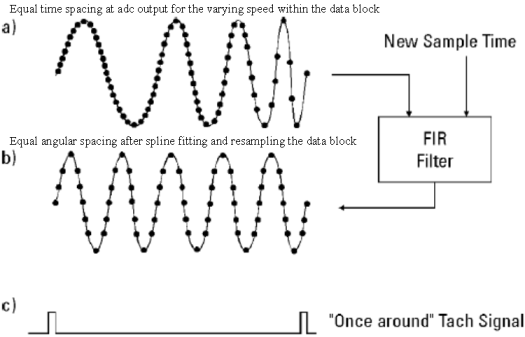
We now use this spline fitted instantaneous speed to stretch and compress the vibration time waveform in a similar way, and create a “turns” axis.
We now “resample” the time waveform at equal points on the “turns” axis by interpolating between the actual sample points, which we then do an fft on.
The proof of accuracy is than there is no smearing.
The fft produces a “shaft orders” spectrum with no sense of machine speed, but knowing the total number of turns and the total sampling time, we can calculate the average machine speed, say 19.6 Hz, and this is the frequency at 1 order, so for a 128 order spectrum we know the max frequency is 2,508.08 Hz.
This is computationally expensive, so some data collectors try change the adc sample rate in real time, based on an exponential running average of the last few turns, so they are always wrong to some extent. They suffer badly from “lag” due to the averaging, causing them to be too slow when the machine is accelerating and too fast when decelerating, with overshoot at each change of direction.
Many companies persist with an even bigger waste of time, trying to avoid using a tacho probe for speed measurement. They do a Cepstrum of the spectrum to look for a quefrency, which is close to the expected drive speed. With variable speed machines the Pc has no idea of speed, anywhere from stopped to full speed, and as the measurements progress to the slower end of the gearbox, input shaft speed harmonics become fewer, ever lower and harder to detect.
Using this method with the complexity of a multispeed gearbox, makes automated diagnosis unreliable and therefore USELESS. Every spectrum would have to be evaluated by a person to find the real speed if possible, and then have a spread sheet to relate all other harmonics and then assign them a cause. With 100’s of spectra from 100’s of machines each day, this is not viable due to boredom, and damage the state of that persons mind after a few months.
|