|
Is your System analysis of trends and faults too time consuming?
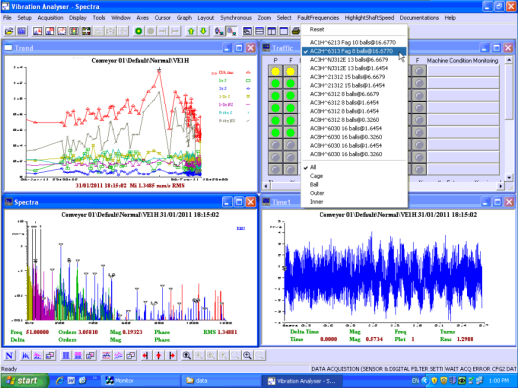
We have fast “drill down”. Just click on a yellow or red traffic light beside a machine name, and the trend in alarm will appear, click on a date time point on the trend graph and the spectrum appears, and if that point is in alarm a waveform will appear as well.
The spectrum Sync lines are color coded for each shaft speed , the highest speed being red, then green, purple and gold, etc.
If the major peaks are all highlighted synchronous lines, a likely shaft or gear related fault is dominant.
If the major peaks are not highlighted synchronous lines, it’s a likely bearing related fault.
To manually confirm a faulty bearing click on the “fault frequencies” toolbar button, and select the number of a bearing to superimpose on the spectrum, and check the “fit”. The outer ring fault line highlighted “0” is a near perfect fit for the harmonic series highlighted with the cursor, so the it’s very likely to be a Fag 6313 fault on the high speed shaft rotating at 16.677 Hz.
In this case, on the 31/1/11, the dominant Trend line is (9-64x) Non Sync (gray trend line with / marks). and the dominant spectral lines are not colour highlighted, and thus Non Sync, so the source of the trend line. The spectrum cursor is lined up with an outer ring fault of a 6313 ball bearing (determined from the tacho), which confirms the Non Sync data as definitely from a bearing, and the exact one.
At the start of Feb (last 5% of the time axis) the Non Sync line drops suddenly but nothing else changes much, which corresponds to a bearing replacement. So the non sync band rises with a fault and falls with a good repair, as expected.
The major fall in this trend line about 3 days after the maximum is due to the pit edges being rounded over and the rising again as new sharp edges are formed, then a gradual reduction as they extend along the track. It’s an interesting situation where the total damage is increasing but sometimes the measured parameter reduces. Another interesting thing about this case is there never was any significant high frequency vibration generated, it remained around 0.5 g’s rms and no harmonics in demod.
So “high frequency only” Shock Pulse and Ultrasonic methods would have completely missed this fault.
read on….
To enable automatic trending of specific fault types, each measurement is divided up into various frequency ranges, and then subdivided into Sync and Non Sync, which can be interpreted as follows :-
|
RMS Overall(Vel&Acc)
|
A general level of vibration for rough determination of severity, not analysis.
|
|
Sub Sync. (Vel)
|
Less than 0.8x shaft speed, process vib, looseness, harmonics of belt rotation.
|
|
1x sync (Vel)
|
Imbalance always at 1x shaft speed, misalignment 70% chance, could be both.
|
|
2x sync (Vel)
|
Misalignment 100%, except roots blowers & recip mach’s.
|
|
1-8x non sync (Vel)
|
Process vib, 1x “ball pass frequency”, harmonics of belt rotation.
|
|
3-8x sync (Vel)
|
Looseness, porting pulsation’s of roots blowers, blade pass vib of pumps.
|
|
9-128x sync (Vel)
|
First 4 harmonics of gear mesh, vac pump blade pass & roots blower pulses.
|
|
9-128x non sync (Vel)
|
Bearing faults, 2 to 20 harmonics of a bearing faults (separates brg & gear vib).
|
|
Peak - peak O/all (Vel)
|
Sensitive to looseness impacts and total deflection of machine / foundation.
|
|
1-3 kHz (Acceleration)
|
Generally gear vibration but can be bearing track faults when gears not present.
|
|
3-13 kHz (Acceleration)
|
Poor lubrication, bearing track faults, can be very high harmonics of gear mesh.
|
|
Peak - peak O/all (Acc)
|
Sensitive to impacts, bearing track faults, shaft rubs & single tooth gear faults.
|
|